Proof of Play Data is great, but it’s even better when visualised
Our Proof of Play BETA is progressing well, and we have a number of Users set up and running with it.
They are giving us great feedback, but we would love some more. If you are interested in getting set up with Proof of Play so that you can start to show ROI then please get in touch.
One thing we are being asked for a lot is a way to visualise the data that is being produced. Although it would be possible for us to go ahead and create some charts for our Users, to meet specific use cases, there is so much data available, we would never be able to produce all of the different variants everyone is looking for.
The approach we have decided to take, is suggest that you use data visualisation tools which are available, from something like Microsoft Excel to great tools like DataHero or Geckoboard.
I have put together some example charts from an example Verbose Proof of Play report, to show you what could be achieved and then how you could start to compare this to your other business specific data such as audience measurement, which I’ll be blogging about soon, so keep your eyes peeled..
So what are some of the visualisations you might want to produce?
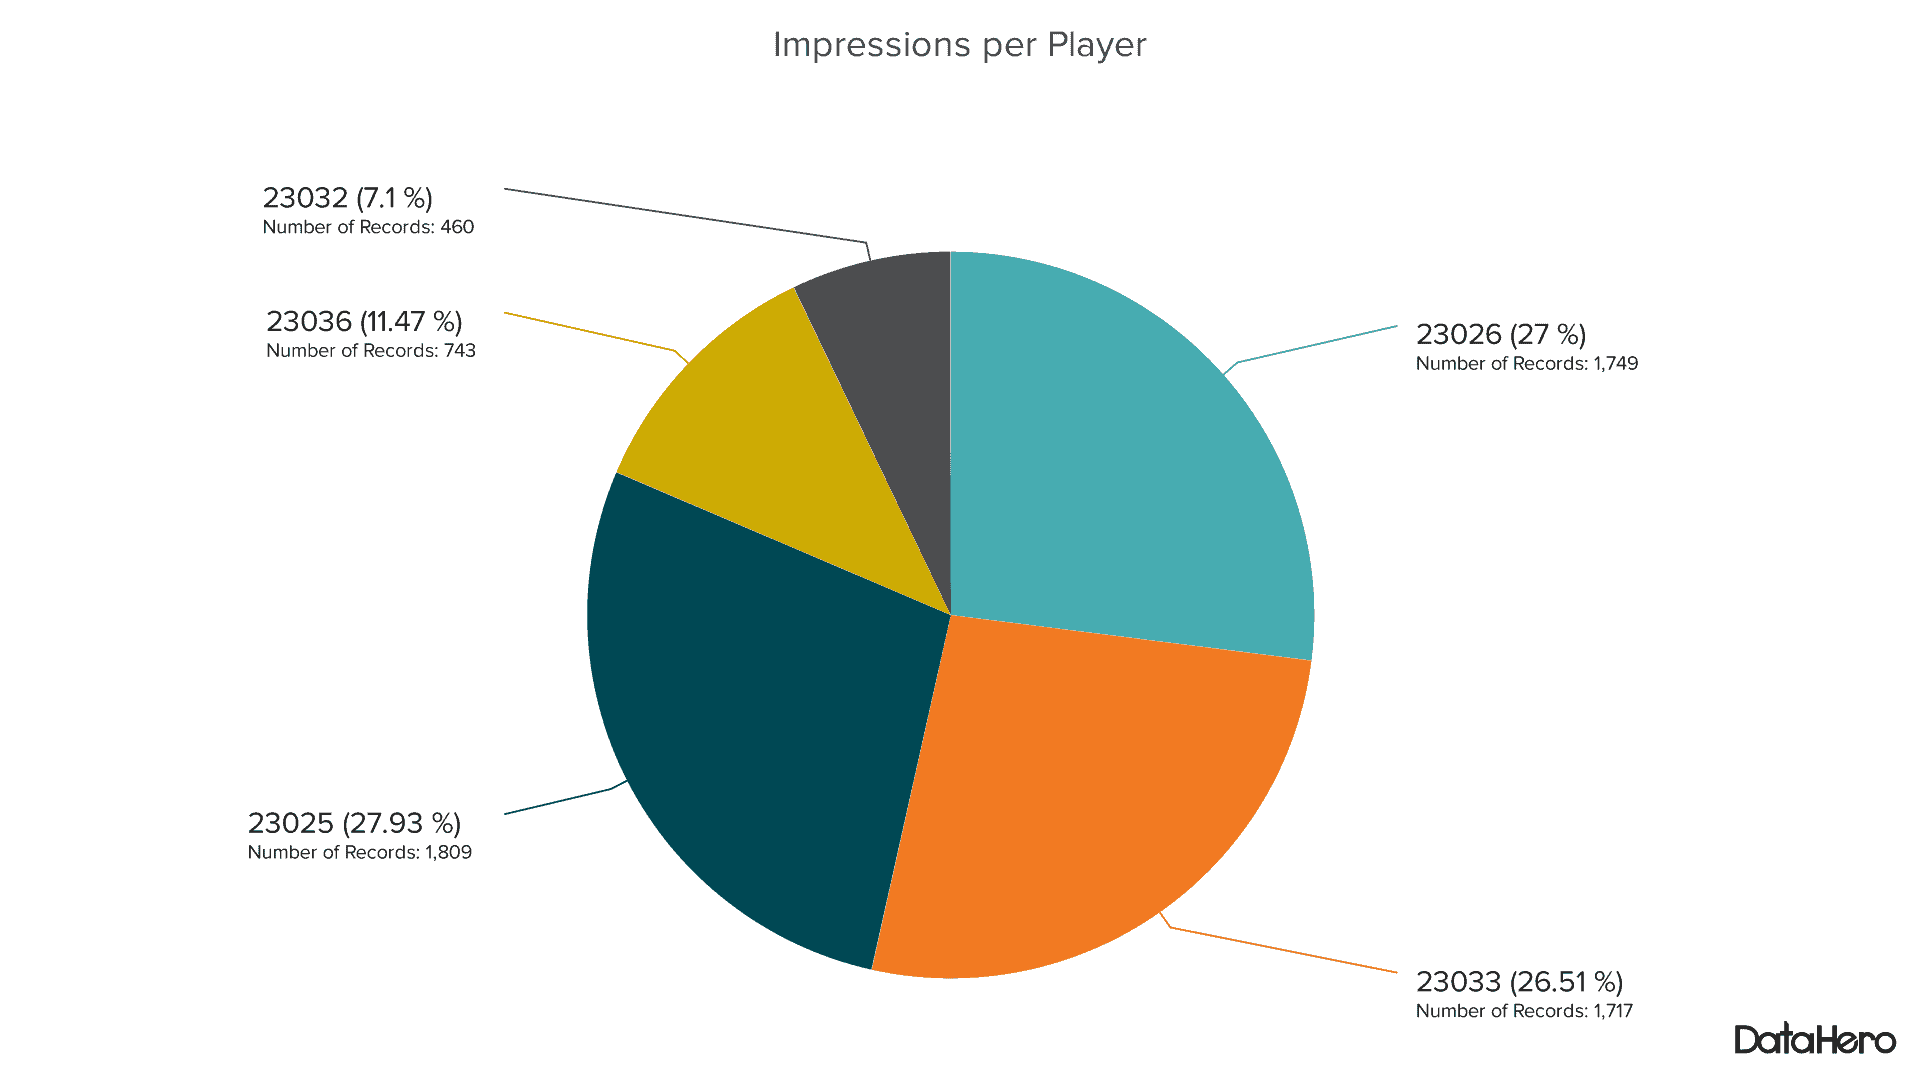
Impressions per Player
This visualisation allows you to see how many impressions each individual player is making, this is for everything you have set up to log impressions which is scheduled on the Players included in the report.
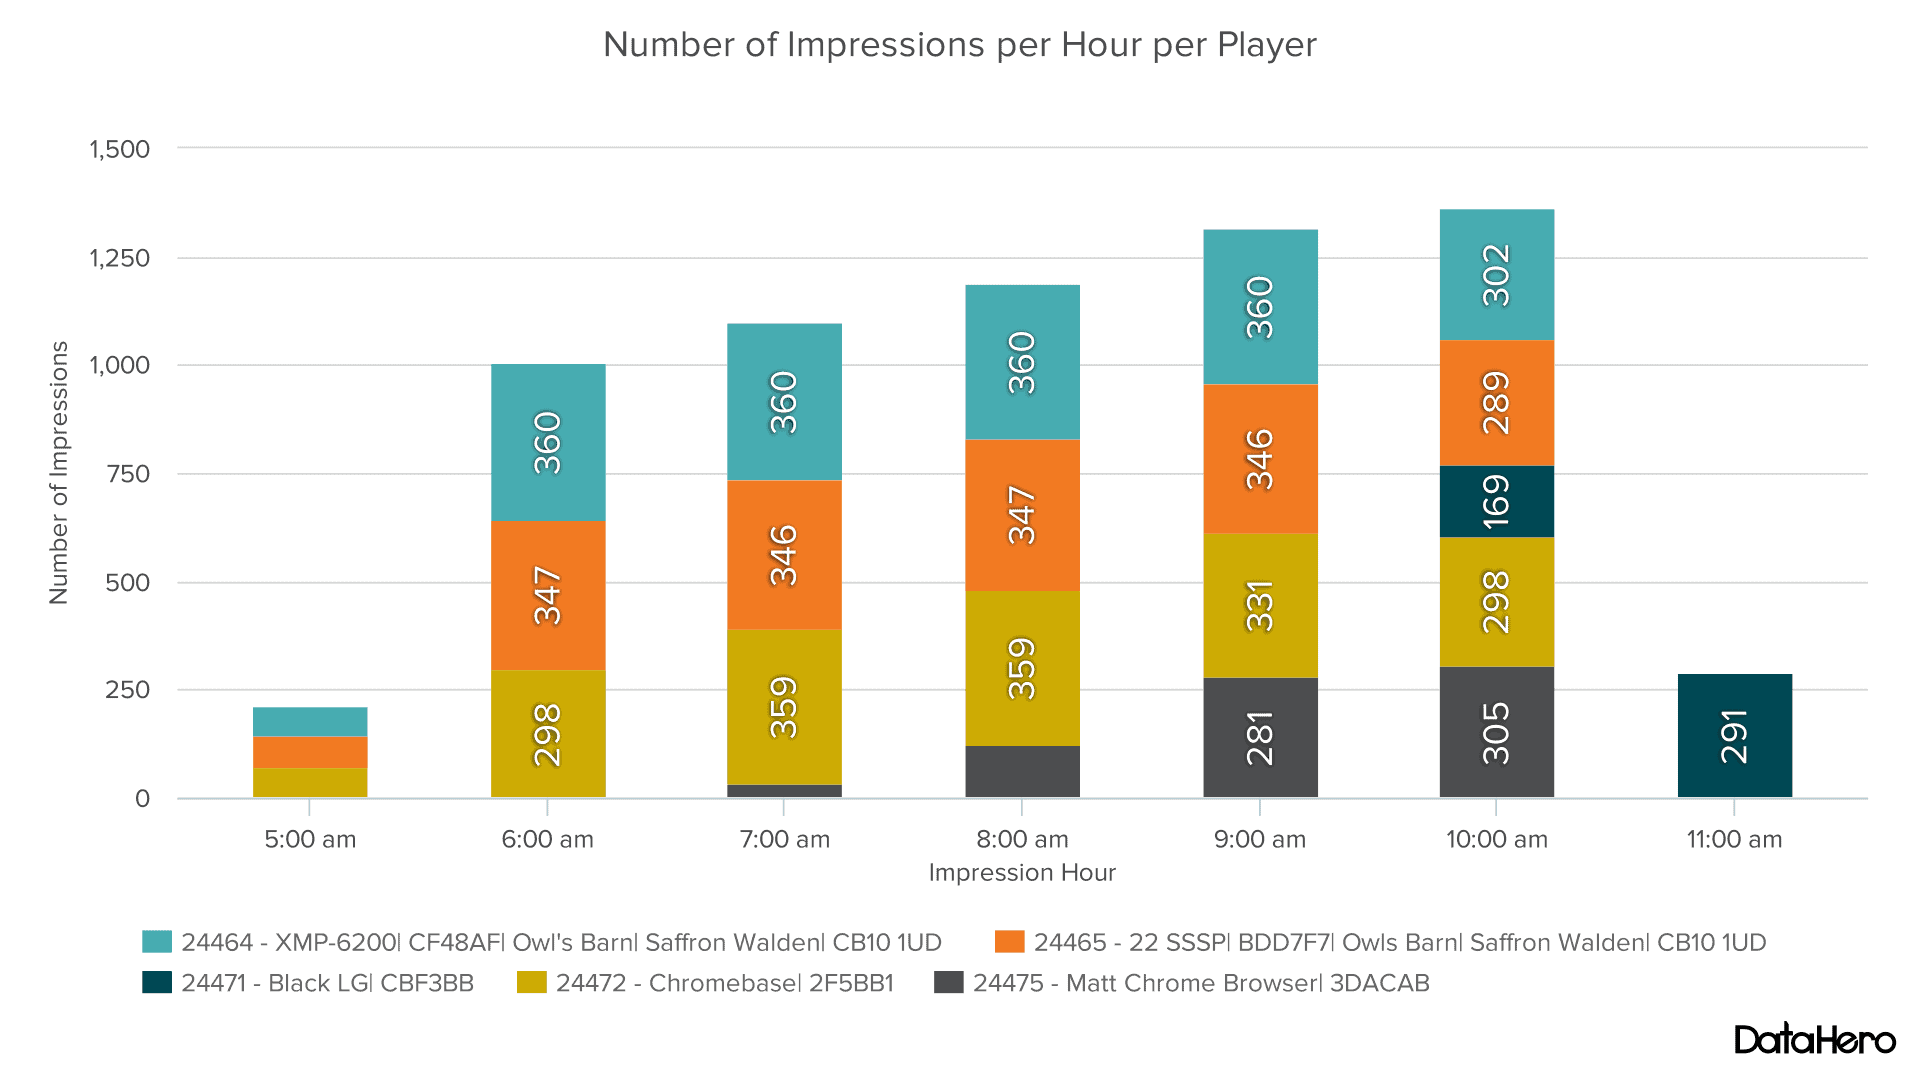
Impressions per Hour for each Player
This is showing how many impressions a Player is logging split by hour of the day. Not only does this show you how the impressions are spread through the day, but also lets you see the hours where impressions aren’t being logged, which should be down to screen control settings within Signagelive or opening hours of a store for example.
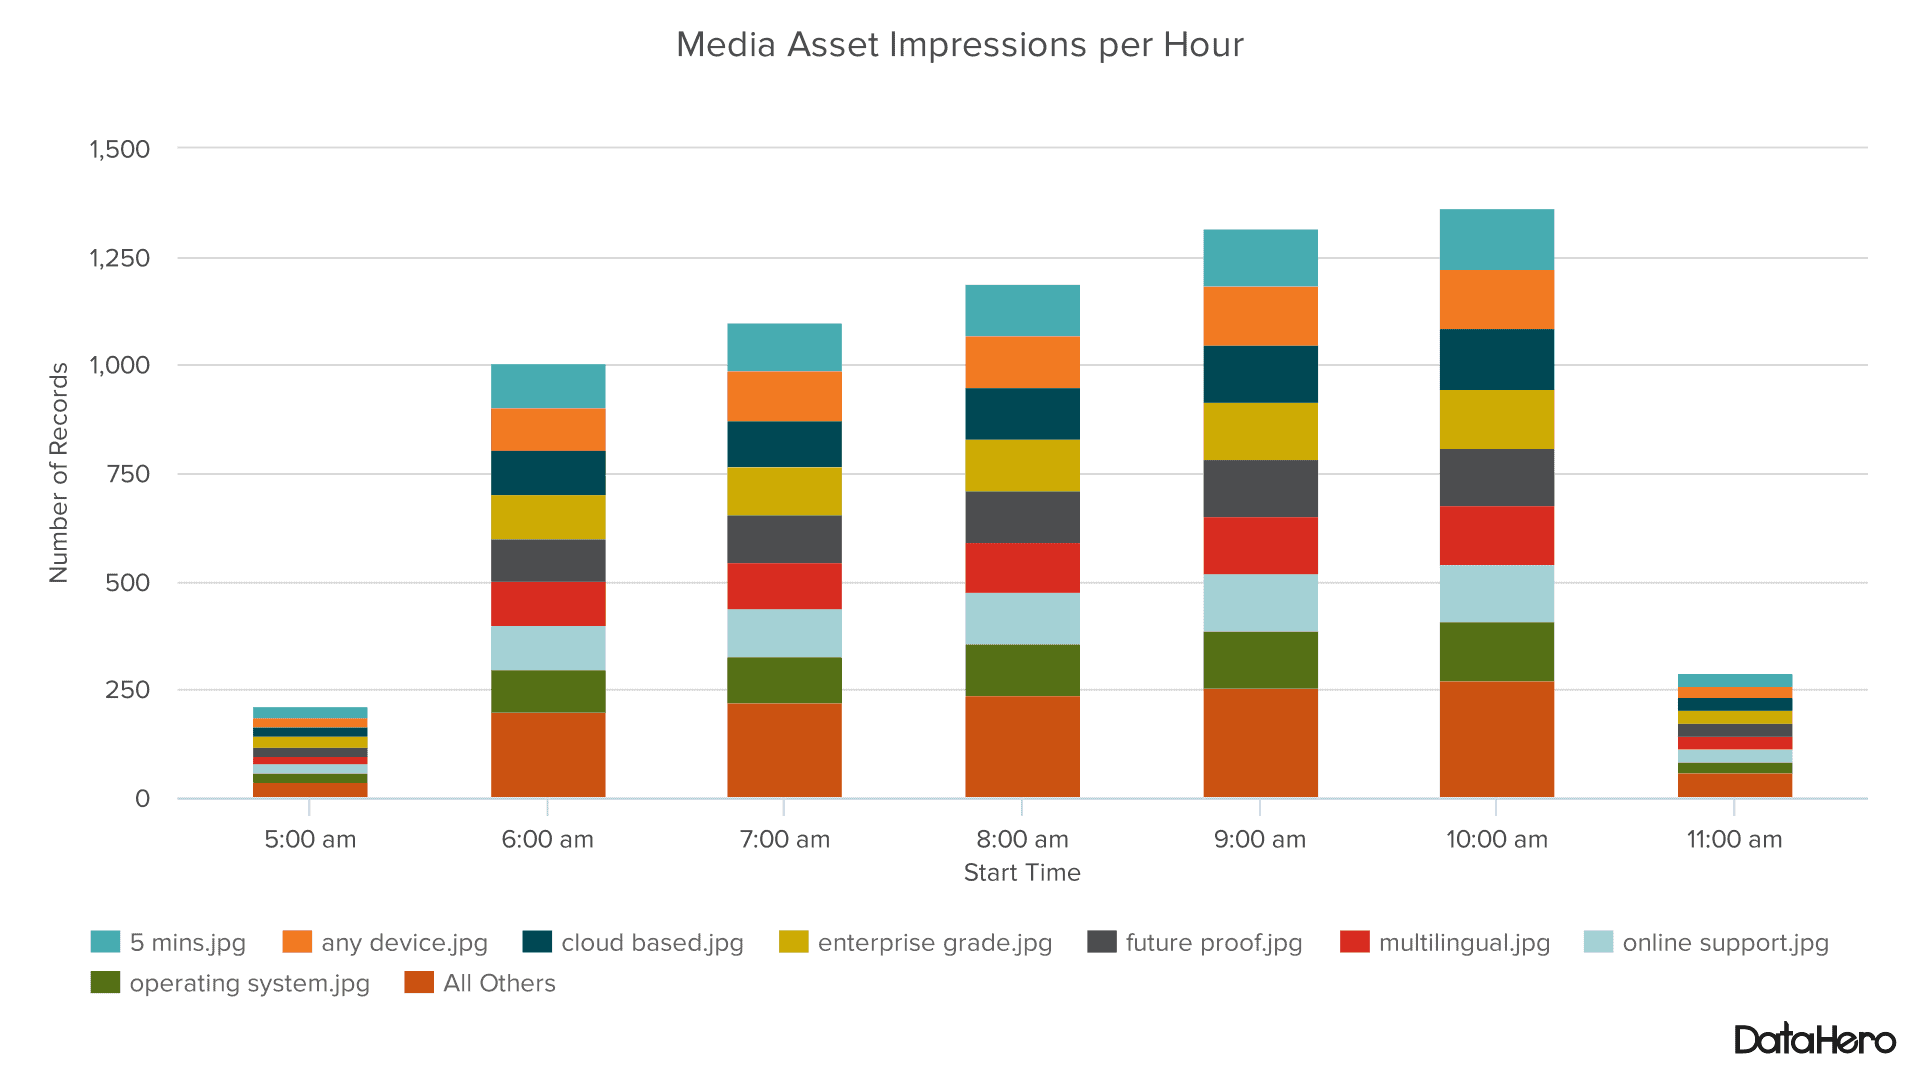
Media Asset Impressions per Hour
When during the day are particular Media Assets playing, and is it then possible to correlate this with an increase in footfall, or improved sales figures.
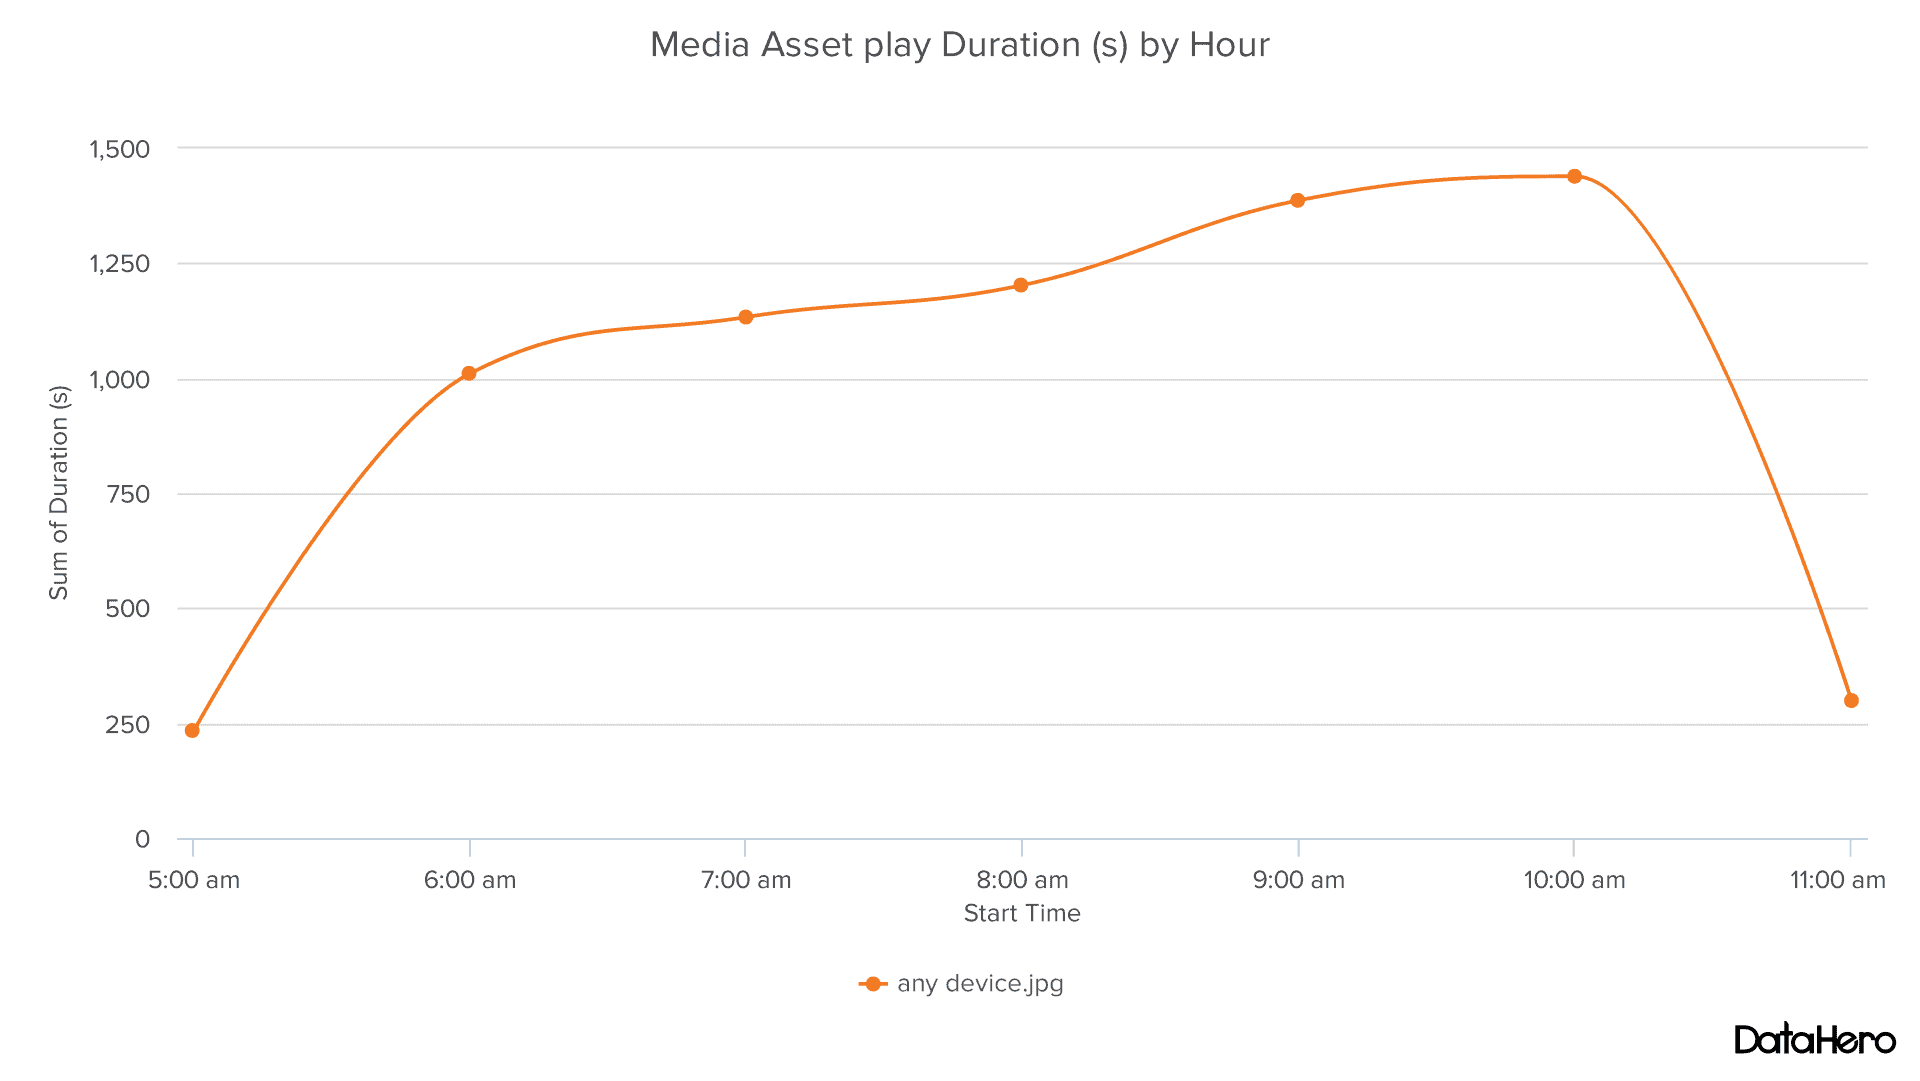
Media Asset play duration by Hour
Filtered to show a single Media Asset we can see how the duration of play for this Asset changes by the hour of the day, through the period of the report.
These are all produced, using the reports created from our Proof of Play module, but what about the potential for creating your own live dashboard. You could have visualisations like these being shown on a Signagelive powered display, with a connection to the live data API. If this sounds like something that interests you then get in touch to discuss further.