Data is perhaps the most precious, but under-utilised resource in business today. While it can, according to McKinsey Global Institute, drive the growth of organisations, making them up to 19 times more likely to be profitable, businesses of every size are still struggling to unlock its full potential. Sealed away behind password-protected files, and often with access restricted to C-suite executives and a handful of data or IT analysts, data is rarely seen company-wide, nor its value ever realised. The advent of Microsoft Power BI is, however, driving change, making it easier for businesses to share data and enable team members at every level of the organisation to interact with it.
What is Microsoft Power BI?
A powerful and scalable business analytics solution, Power BI unifies data from many sources to create interactive dashboards and reports that can provide real, actionable, and profit-boosting insights. With the free-to-download Power BI desktop, you can connect to a myriad of data sources, including Excel, and Salesforce, as well as create reports with a variety of data visualisations, such as column charts, pie charts and heat maps to tell stories and share insights.
Intuitive to use, Power BI’s integration with Excel is particularly useful, enabling you to transfer all current Excel quotes, data models and reports to Power BI, without learning a new application.
Dashboards are also easy to filter, enabling users to search the data for more specific insights.
The paid for cloud version of Power BI – Power BI service – is where you can publish reports as dashboards and make them available across any device.
Whatever you use Power BI for, your data will be secure. Power BI is designed to meet various security and compliance standards, coming with an array of industry-leading capabilities to ensure that all your data is kept safe.
How can Secure Dashboards help your Power BI data visualisation strategy?
With Signagelive Secure Dashboards, you can safely scale out your Power BI data visualisation strategy. Taking enterprise-wide data sharing to the next level, it enables you to bring the latest data to all your teams in real time through the secure display of dashboards on your workplace Digital Signage.
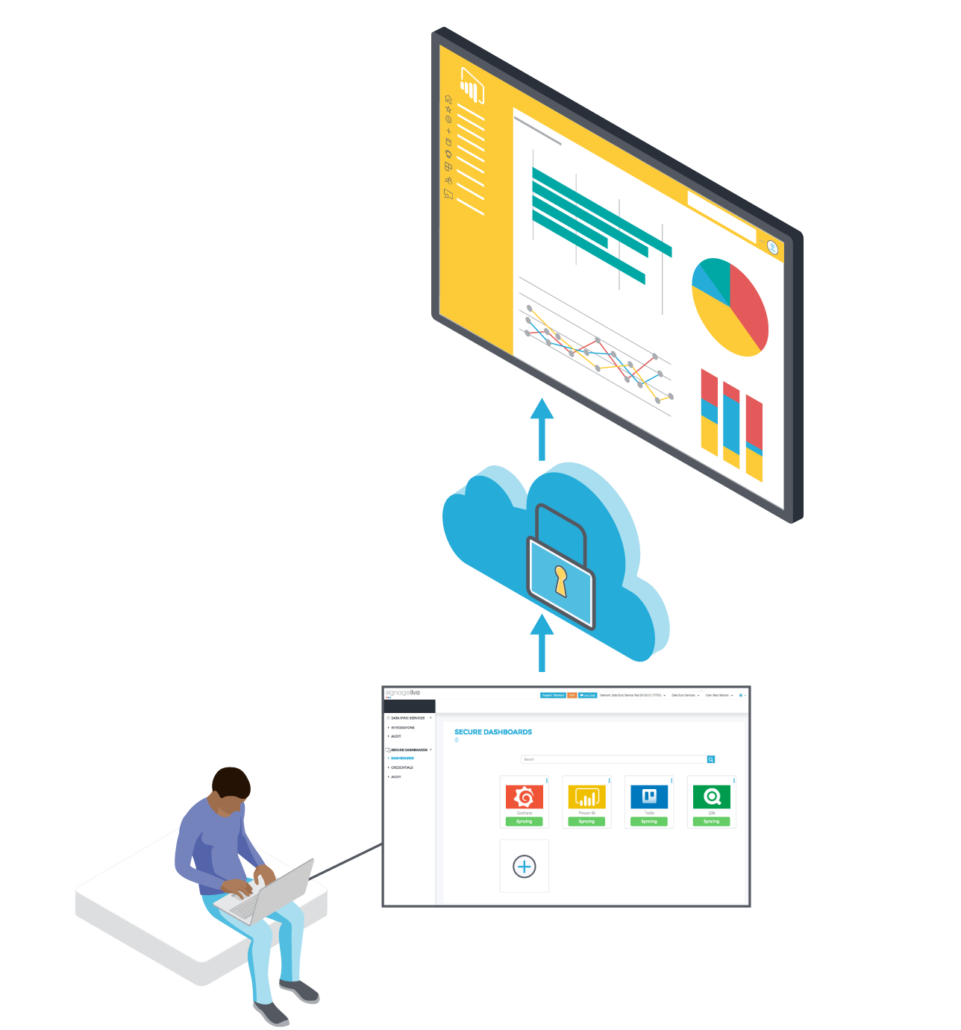
Designed to support most dashboard tools, it can securely display almost any password-protected URL. The system works by logging into your selected dashboard application, capturing a snapshot of the dashboard or metric that you would like to display, and then sending it to your list of approved players via Signagelive.
With this solution, you won’t ever have to risk making your data public via URL or share and expose your login credentials. All your data is secure in the cloud, and your credentials, as well as the API Keys, are protected in the Secret Manager. As an additional security measure, our Data Sync Services application checks to ensure that every player that receives images is actually approved to do so.
A scalable solution
Making it easier to scale up your data analytics strategy, the Data Sync Services application also offers a smart login, which enables you to use a single password for multiple dashboards. This means that, if you should ever need to update your credentials, you won’t have to reconfigure your login details for every individual dashboard.
Whatever the scale of your Digital Signage network, you can be sure of more flexibility with Secure Dashboards. Choose the frequency with which your data is refreshed on screen, with options, which range from every five minutes through to an hour. Alternatively, for slower-changing data, schedule updates for specific times of day.
What are the benefits of displaying Power BI dashboards on your Digital Signage?
With Signagelive Secure Dashboards, you can amplify the reach and impact of your Power BI data visualisation strategy. Through the secure display of data on your workplace screens, you have, in effect, more opportunity to empower entire teams and departments and immerse them in the insights they need to make better business decisions.
Sales data dashboards
Sales teams can, for example, greatly benefit from the display of sales data dashboards. Keep team members motivated and on track by enabling them to see, at a glance, sales figures against expected targets. Merge data from different CRM systems to create a more in-depth analysis, enabling the data to be filtered by new leads, sales manager accounts and year-on-year growth, as well as by meetings booked.
Marketing data dashboards
For marketing, display dedicated dashboards on Google ad words and social media campaigns, so all the team can track them, and change content and spend in real-time, if there are any early signs that the advertising isn’t working. Use web analytics dashboards to understand online traffic and customer engagement, and for a marketing overview, bring multiple dashboards together on one screen to understand the overall department’s performance.
Logistics, call centre and financial data dashboards
While the on-site display of Power BI dashboards can be used to trigger alerts when stock becomes dangerously low in warehouses, the broadcast of call centre analytics can keep staff on target, motivating them to do more to reduce handling times and meet service level agreements.
On the production floor, the large screen display of Overall Equipment Effectiveness (OEE) dashboards is equally helpful when it comes to tracking the productivity of manufacturing lines. Similarly, displaying the process or machine downtime dashboard enables teams to monitor machine performance, and quickly spot any problems before they cause unwanted stops or delays to the production process.
The display of profit and loss statements (P&L) is also valuable for finance performance management, giving managers the data insights they need to understand the general health of the business and what they must do to maximise profitability.
Gamification
Whatever the company department, you can always use the display of your Power BI dashboards for gamification. According to recent statistics, a staggering 89% of employees believe that the use of game techniques in the workplace would motivate them to work harder.
Introducing game-like elements is surprisingly simple. Just by creating interactive leaderboards, to highlight the top performing individuals and teams, you can, for example, gamify the workplace experience and inspire a little friendly competition to increase employee productivity.
Similarly, on-screen goal-tracking is an easy way to help drive more employee engagement, as it fosters a collective sense of progress and triumph when a project is accomplished. Use multi-zone Digital Signage to display goal-tracking dashboards alongside your company social media account, so you can reward top performers with a public social media mention.
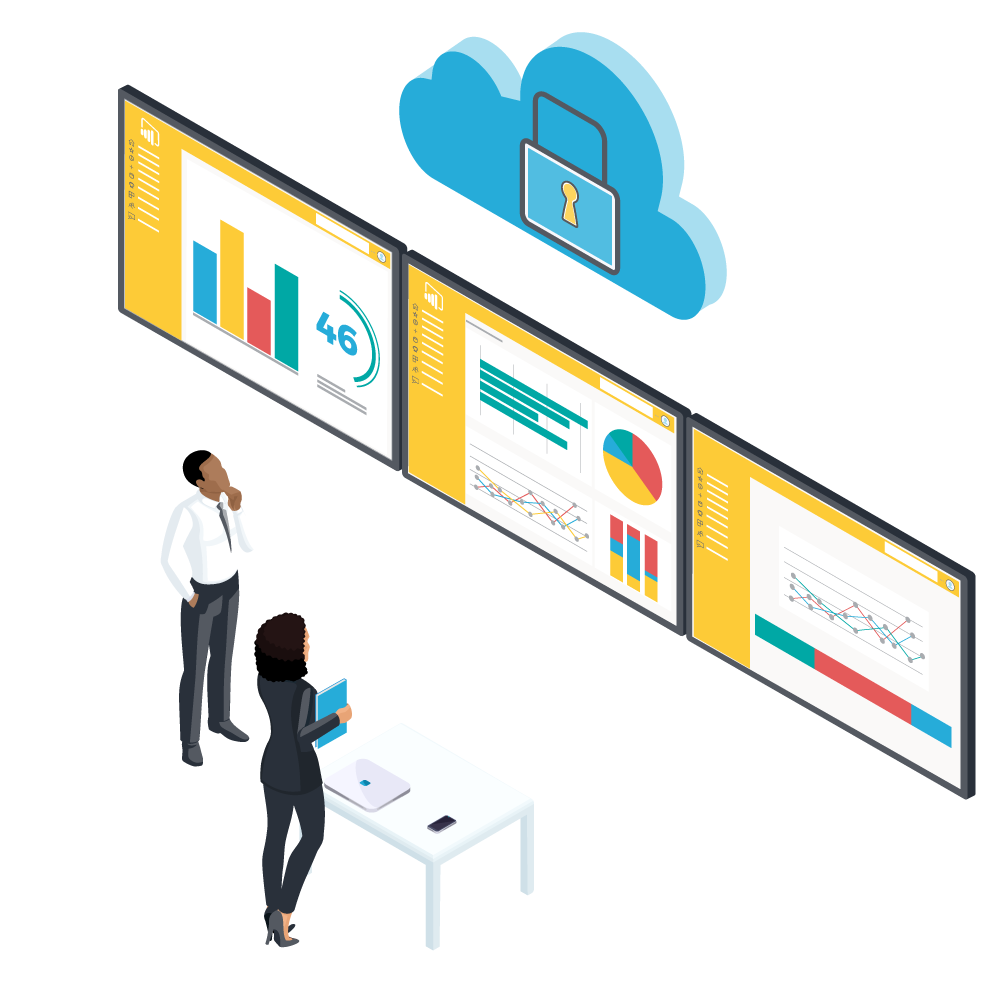
Or why not use a multi-zone Digital Signage layout to display dashboards from different departments at the same time, so that you can give everyone in the company an overview of your business performance? You can also create playlists to cycle through more data visualisations, if there is a particular set of metrics and data insights that you want to highlight.
Given the fact that data-driven decisions can help to boost revenue significantly, it is little surprise that, according to Gartner, an overwhelming 90% of corporate strategies in 2022 are expected to mention data explicitly as a critical enterprise asset and analytics as an essential competency. The good news is that, with the introduction of dashboard tools, such as Power BI, it’s now easier than ever before to share data, and to ensure that, even without training, every team member can use it to uncover actionable insights. With solutions, such as Signagelive Secure Dashboards, this data accessibility can be scaled quickly and safely, enabling more employees to see the latest data analytics through the secure display of live Power BI dashboards on workplace Digital Signage.



You must be logged in to post a comment.